I. Institutional Header
- Report Classification: Category B | Structural Attribution Report
- Report ID: SIDR-2026-ALO-001
- Asset Subject: Alo Yoga (China Market Entry Status)
- Data Cut-Off Date: 2026-03-13
- Model Version: BCI Structural Integrity Protocol v2.0( Sentimental Asset Logic)
- Data Reliability Grade (DRG): Tier-2 (Market Proxy & Unauthorized Distribution Backtest)
- Research Domain: Intangible Asset Valuation & Premium Brand Economics
II. Executive Summary: Structural Status Reading
The Phenomenon: The target asset is initiating physical retail expansion within core Chinese commercial districts (e.g., Sanlitun, Jing’an Kerry Centre). However, before the establishment of official physical interfaces, the asset’s symbolic system had already undergone profound regional diffusion driven by an explosive, unauthorized “proxy” and counterfeit ecosystem.
The Latency Gap: Financial statements are projected to record a significant revenue pulse (Channel Fill & Novelty Spike) during the initial 2-3 quarters of physical retail operations. Due to the inherent latency of traditional accounting standards, the balance sheet is unlikely to immediately reflect the structural overdraft of the asset’s underlying “cognitive sovereignty.” Assuming management possessed current BCI readings, the structural entropy acceleration preceding this market entry appears structurally consistent with conditions that, under BCI monitoring frameworks, would normally trigger capital intervention.
-
BCI Core Reading:
- BCI Score: 4.2
- Confidence Band: ± 0.15
- Momentum Vector: Downward Slope
Market Reference Context:
Within BCI historical observations of premium lifestyle brands, readings below BCI 5 have frequently preceded sustained compression of pricing power, accompanied by rapid PL expansion signals.
Market Context Anchor: Premium athleisure brands have experienced accelerated valuation expansion following the post-pandemic consumer shift toward performance lifestyle products, creating a temporary macroeconomic masking effect on underlying structural vulnerabilities.
III. The BCI Dashboard & Historical Trajectory
1. BCI Core Derivatives
- BDI (BCI Duration Index): 1.2 Years. The theoretical remaining time window for the asset to maintain its current premium multiple without initiating a large-scale downgrade in pricing power.
- BDV (BCI Dilution Velocity): +0.85/{Quartile}. The proliferation of the unauthorized ecosystem is driving a PL expansion that dilutes MT at an extreme, unsustainable trajectory.
- SIR (Symbolic Insulation Ratio): 0.62. A reading of SIR < 1 indicates the asset’s symbolic gravity is no longer sufficient to insulate against cognitive friction, approaching the Commodity Drift threshold under current structural conditions.
2. Historical Trajectory Matrix (Simulated Backtest)
| Quarter | Q1 2025 | Q2 2025 | Q3 2025 | Q4 2025 | Current (Q1 2026) |
| BCI Reading | 6.5 | 5.8 | 5.1 | 4.6 | 4.2 |
| Status Phase | Vulnerability | Dissipation | Drift Entry | Drift | Commodity Drift |
(Note: The historical trajectory demonstrates a persistent structural deterioration under current proxy signals, substantiating persistent structural friction signals generated by unauthorized PL expansion under current observable conditions.)
IV. Structural Diagnostics: Variable Decomposition
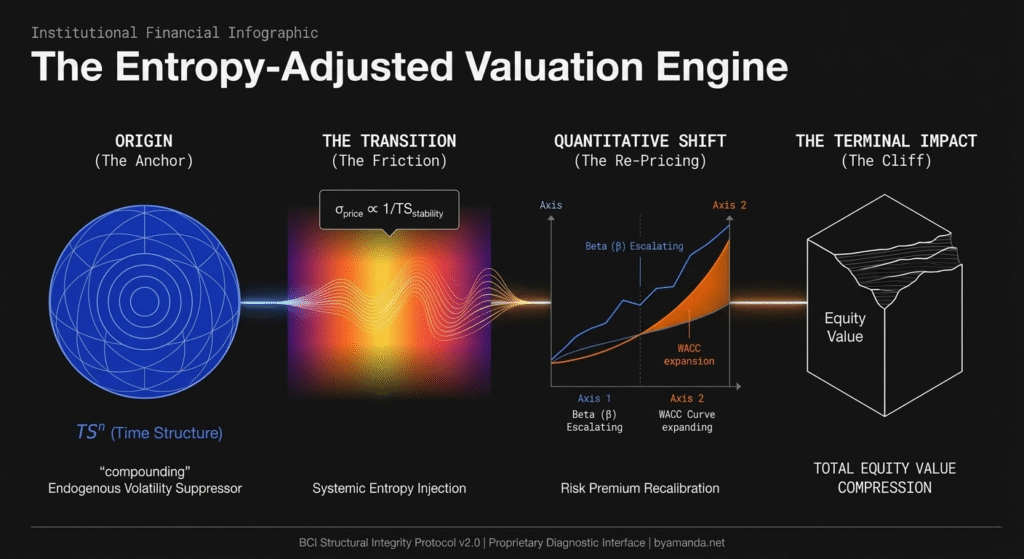
Systemic observation executed via the BCI Structural Integrity Equation:

Observable ES Indicators:
— Cross-border price dispersion between official international channels and local proxy markets.
— Grey-market arbitrage intensity observed across secondary distribution ecosystems.
— Marketing signal amplification within social commerce environments without corresponding official capital reinvestment into the regional brand infrastructure.
Observable Proxies:
- MT→ Resale market premium compression (Secondary market premium converging to zero).
- PL → Unauthorized distribution density (Extremely high SKU visibility via unofficial channels).
- TS → Trend-driven product lifecycle (Lifecycles dictated by momentum rather than structural equity).
Market Evidence Layer:
— Elevated SKU visibility of Alo Yoga products across Chinese cross-border resale platforms and informal digital marketplaces before official retail rollout.
— High density of proxy distribution channels within Tier-1 urban commercial districts relative to the brand’s formal market infrastructure.
— Rapid symbolic diffusion through social commerce environments without accompanying pricing-discipline mechanisms.
V. Capital Transmission Map
WACC Sensitivity: The dilution of cognitive sovereignty has historically correlated with the progressive erosion of pricing power in premium lifestyle asset systems. Assuming the asset faces defensive price-war scenarios, the resulting instability in operating leverage will significantly increase beta volatility, thereby imposing a structural upward drift in the regional WACC.
Terminal Value Sensitivity Analysis:t_{1/2} (Structural Half-Life): 18 Months.
Under current SIR readings, absent a fundamental structural reorganization, the asset’s premium multiple in the regional market may face structural compression of approximately 50% within an 18-month horizon if current structural signals persist.
In DCF modeling, the Terminal Growth Rate (g) must be forcefully adjusted to a negative value to hedge against duration dissipation.
Goodwill Risk Layer: For parent entities or potential M&A acquirers, the short-term revenue explosion in the regional market is highly deceptive. Linear extrapolation based on the initial 24 months of revenue velocity carries a high probability of triggering Covenant breaches and Goodwill Impairment thresholds by Year 3-4.
Multiple Stability Interface:
Assets with a BCI above 8.0 have historically exhibited stable premium multiples (premium performance apparel valuation bands) due to sustained MT and TS compounding.
At a current BCI of 4.2, the asset falls into the Commodity Drift Band. Its rational valuation anchor should converge toward traditional apparel manufacturing multiples (commodity apparel valuation bands); capital deployment above this band constitutes naked risk exposure.
BCI Reference Context:
Across BCI-monitored premium assets, sustained readings above BCI 8 have historically coincided with durable premium multiple regimes supported by high MT density and long TS compounding cycles.
VI. Governance Option Descriptions
Based on BCI structural dynamics, we map the following capital consideration paths (We map, you choose):
Scenario A: The Scale Extraction Path
Action: Exploit current cognitive momentum to accelerate mass-market channel penetration, maximizing short-term unit economics and ROI.
BCI Trajectory: 4.2 → 3.0 over 12 months.
Capital Consideration: Progressive conversion of MT into transactional scale to capture the cash flow surge of PL overload. The trade-off is a compression of t_{1/2} to under 9 months, finalizing the commodity drift and resulting in an abrupt collapse of valuation multiples.
Scenario B: The Sovereign Contraction Path
Action: Artificially restrict physical expansion velocity. Execute dual physical and legal suppression of the unauthorized ecosystem, forcing an aggressive elevation of MT entry barriers via uncompromising physical sanctuary experiences.
BCI Trajectory: 4.2→5.5 over 24 months.
Capital Consideration: Absorbing massive short-term enforcement expenditures (elevated ES output) and the risk of missing consensus revenue estimates, exchanged for the rehabilitation of SIR and the long-term defense of Terminal Value.
VII. Institutional Footer: The Liability Layering
- Rating Limitation: BCI readings and associated derivative metrics (BDI, BDV, SIR) provided in this report are intended solely as physical mapping tools for assessing asset structural integrity. They do not constitute credit ratings, security analysis, or corporate valuation directives.
- Reassessment Trigger Statement: Should the target asset execute material pricing-structure adjustments, fundamentally rebuild its creative/supply-chain provenance, or trigger large-scale M&A defense mechanisms, the current slope and terminal-value forecasts herein are immediately invalidated, requiring a retriggering of structural diagnostics.
- Jurisdictional Limitation: The interpretative authority of this report and its derivative data is governed exclusively by the legal framework of the Hong Kong Special Administrative Region.
- Research Independence Statement: BCI Lab operates independently and does not accept commissioned analytical mandates for structural diagnostics. This report is the natural output of internal monitoring protocols.
Framework Clarification:
The BCI framework measures structural forces acting upon intangible asset systems through observable market proxies.It does not evaluate the brand’s aesthetic or cultural merit.