Public Institutional Release Framework
(Structural Attribution Audit)
Cover Page
- Report Classification: Structural Attribution Audit (Category B)
- Protocol Basis: BCI Structural Integrity Protocol v2.0
- File No.: SAR-2026-LULU-009
- Asset: Lululemon Athletica Inc. (NASDAQ: LULU)
- Data Cut-Off: 2026.01.31
- Data Reliability Grade: A
- Issuing Authority: BCI Governance Committee
- Methodology Transparency Tier: Tier I
- Conflict Independence Status: Independent
Independence & Methodology Declaration
Independence Statement
This report is using the proprietary analytical framework developed by BCI Lab, which is based exclusively on publicly available financial disclosures from Lululemon Athletica Inc., including SEC filings, together with third-party retail channel monitoring data.
No financial sponsorship, commissioned engagement, or non-public information from the brand or its affiliated entities has been incorporated into this analysis.
Scope of Engagement
The scope of this report is limited to structural attribution analysis, intended to identify potential sources contributing to changes in an asset’s premium-generation capacity.
This document does not constitute investment advice, nor should it be interpreted as a recommendation to buy, sell, or hold any security. The analysis does not attempt to determine the intrinsic valuation of the underlying equity instrument.
Methodological Reference
Model Structure:
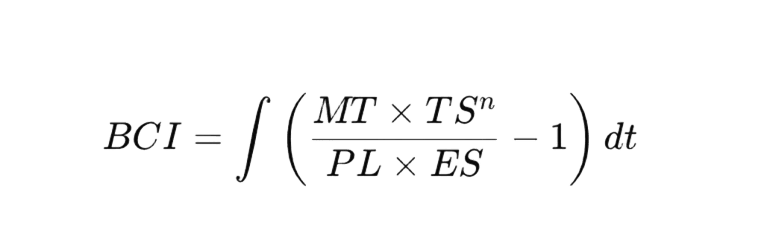
Calibration Framework: BCI Calibration Engine v2.0 (Activewear / Lifestyle Universe)
Statistical Confidence Range:95% confidence interval
Interpretations presented in this report should therefore be understood as structural diagnostics derived from observable market signals, rather than deterministic forecasts.
Data Hierarchy Disclosure:
- Primary Data: SEC 10-K/Q revenue mix, Average Unit Retail (AUR) variance.
- Secondary Data: Inventory turnover velocity per square foot.
- Proxy Data: Community engagement decay rates, secondary market liquidity (resale value).
- Research Domain: Premium Brand Equity & Intangible Asset Structural Analysis
Framework Clarification:
The BCI framework measures structural forces acting upon intangible asset systems through observable market proxies.
It does not evaluate product quality, cultural merit, or brand desirability.
Interpretations should therefore be understood strictly as structural diagnostics rather than aesthetic judgment.
Executive Structural Reading
- Current BCI Score: 7.12
- Confidence Band: ±0.28
- Structural Classification: Terminal Perceptual Saturation Phase
Sector Calibration Universe (Prestige Activewear):
- Median BCI: 6.55
- Top Quartile Threshold: 7.90 (e.g., Arc’teryx, Alo Yoga)
Historical Correlation Disclosure:
Within the 2016–2025 consumer-discretionary dataset, assets exhibiting PL saturation >2.5 sigma without a corresponding “Narrative Recalibration” experienced an average long-term valuation multiple compression from 35x to 18x EV/EBITDA as the asset transitions from “Sovereign Community” to “Utility Infrastructure.”
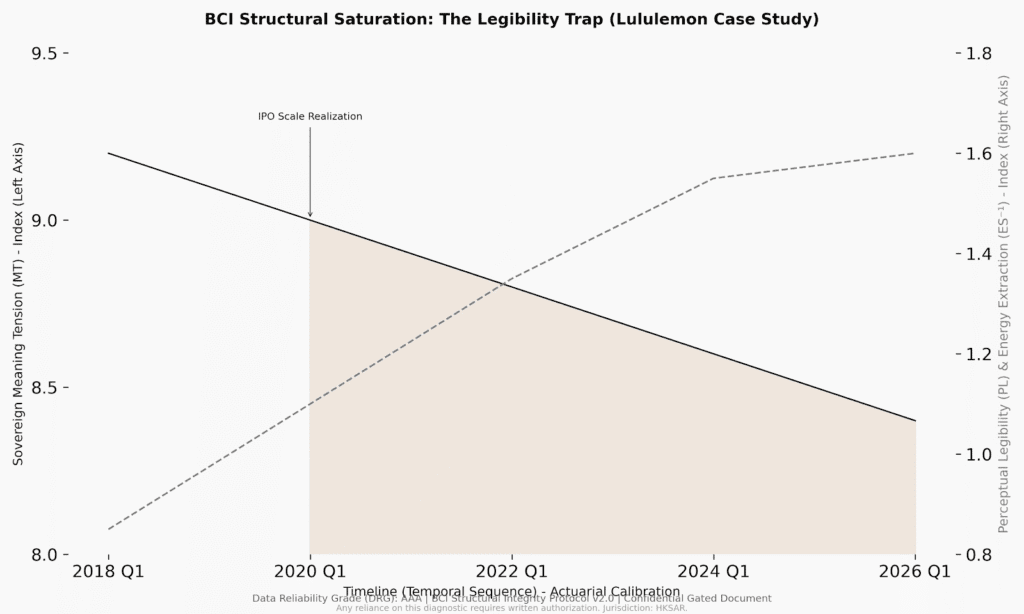
Core Diagnosis:
Current observable signals are structurally consistent with a state of “Perceptual Saturation”.The asset has maximized its Perceptual Legibility (PL) to a point of zero-marginal symbolic utility. The structural integrity is currently maintained by logistical efficiency (ES) rather than Meaning Tension (MT).
Observable proxies currently indicate that operational efficiency is increasingly responsible for margin defense.
Key indicators include:
- Inventory turnover acceleration across North American DTC channels
- Stable AUR despite rising promotional density
- Declining resale premium dispersion across secondary markets
Interpretation:
These signals are historically associated with systems where Energy State (ES) compensates for declining Meaning Tension (MT).
Historically, assets entering the Terminal Perceptual Saturation Phase exhibit:
- declining valuation multiple elasticity to revenue growth
- margin sensitivity to distribution expansion
- increasing dependence on promotional activity to maintain volume
Within the BCI calibration dataset, comparable assets saw EV/EBITDA multiple compression of 30–45% over the long term once they entered this structural phase.
Note:
These outcomes are historical correlations rather than deterministic projections.
Dimensional Decomposition
Meaning Tension (MT)
- Finding: Structural weakening.
- Driver: Transition from “Spiritual/Community Anchor” to “Universal Utility.”
- Risk: MT is now inversely correlated with distribution density. The “meaning” has become too legible, neutralizing the premium defense.
Temporal Structure (TSⁿ)
- Finding: Robust but plateauing.
- Constraint: The “Yoga Legacy” provides a stable floor, but the n coefficient (elasticity) is decreasing as the brand enters the mass-market replacement cycle.
Perceptual Legibility (PL)
- Finding: At threshold (Saturation).
- Observation: Zero cognitive friction in the purchasing path. While driving short-term volume, this amplifies substitutability risk and undermines the “Sovereign Margin.”
Energy State (ES)
- Finding: High extraction, Low nourishment.
- Issue: ES^{-1} is optimized for high-velocity inventory turns. The system is “extracting” brand equity to fund top-line growth, with insufficient “re-nourishment” of the symbolic layer.
Longitudinal Stability Analysis
| Period | BCI Score | MT Variance | PL Velocity | ES Extraction |
| 2024 Q4 | 7.45 | -0.05 | +1.1σ | 1.10 |
| 2025 Q2 | 7.32 | -0.12 | +1.8σ | 1.25 |
| 2025 Q4 | 7.18 | -0.18 | +2.2σ | 1.42 |
| 2026 Q1 | 7.12 | -0.22 | +2.5σ (Peak) | 1.55 |
Stability Range: 7.05–7.30 (Projected Range).
Interpretation: The asset has entered a Structural Compression Zone. Future revenue growth is increasingly dependent on PL-driven volume rather than MT-driven margin.
Peer Positioning Matrix
- Axis X: Perceptual Legibility (PL)
- Axis Y: Meaning Depth (MT)
- Quadrant Mapping:
- Arc’teryx: High MT / Moderate-Rising PL (The “Overheating” Peer)
- Alo Yoga: High MT / Moderate PL (The “Sovereign” Threat)
- Lululemon: Low-Moderate MT / High-Peak PL (The “Utility” Bench)
- Nike: Low MT / High PL (The “Commodity” Baseline)
Peer positioning is derived from the BCI Activewear Calibration Universe (2016–2025 dataset) and reflects relative structural signals rather than cultural or aesthetic evaluation.
Structural Risk Identification
Risk Type 1: Commodity Trap (PL-Saturation)
Probability Level: High (Confirmed)
Impact: Margin erosion via aggressive discounting and promotional dependency.
Risk Type 2: Narrative Exhaustion (MT-Decay)
Probability Level: High
Governance Indicator: Secondary market price retention (Resale index).
Structural Inflection Point Assessment
- Identified Inflection: FY2024 (Scale Over-reach)
- Type: Sovereignty-to-Infrastructure Pivot.
- Clarification: The asset is no longer functioning as a “luxury/sovereign” entity; it has successfully pivoted into a “high-end utility” role. This stabilizes the floor but removes the “Upward Re-rating” potential associated with scarcity.
Scenario Simulation (Non-Prescriptive)
- Base Case: BCI stabilizes at 6.80; asset functions as a high-margin commodity leader.
- Sovereignty Recovery Case: Intentional distribution contraction (-15% POS); PL reduction -0.8; MT re-stocking via niche category isolation; BCI rebounds to 7.85.
- Aggressive Expansion Case: PL breaks >3.0σ via mass wholesale; BCI drops to 5.50; Valuation re-rates to apparel-industry median.
Cultural Capital Buffer Assessment
- Historical Anchor Strength Index: 8.8/10
- Residual Premium Defense Estimate: 24–36 months.
- Downside Protection Level: Strong. The technical IP (Luon/Nulu) acts as a structural stabilizer despite symbolic erosion.
Governance Monitoring Indicators
- Audit Recommended Monitoring:
- AUR / Volume Elasticity: The point where price increases trigger >1:1 volume decline.
- Narrative Density Index: Organic social mentions in non-performance (lifestyle) contexts.
- DTC vs. Wholesale Margin Spread: Monitoring the cost of “maintaining legibility.”
- Model Archival: File ID LULU-2026-009. Dual-Signatory Protocol.
Strategic Interpretation:
These indicators are designed to pinpoint the moment when volume growth begins to put structural pressure on symbolic margin protection.
Conclusion – Structural Status Statement
- Category: Structural Attribution (Non-Rating)
- Status: Stable at Terminal Saturation.
- Key Institutional Takeaway: Lululemon is a high-integrity utility asset with depleted symbolic tension. It represents the “Legibility Trap” Within the BCI framework, total market clarity ultimately results in the dissolution of brand sovereignty.
Liability Layering Architecture
- Protocol Ref: This report is using BCI Structural Integrity Protocol v2.0.
- Authorization Clause: Citation of this report for academic or analytical purposes is permitted provided attribution to BCI Lab is maintained.
- Jurisdiction: Interpreted strictly under the HKSAR Legal Framework.
Institutional Observation:
Within the BCI framework, Lululemon currently represents a canonical case of the Lululemon Legibility Trap — a structural condition where maximal market clarity gradually dissolves symbolic scarcity.
This phase historically stabilizes revenue floors while limiting further valuation re-rating.