Category C Structural Integrity Audit: Birkenstock (BIRK) Post-IPO Asset Resistance
BIRK Post-IPO Structural Audit | BCI Stress Test
Research Classification
BCI Category: Category C — Structural Integrity Report (5-Year Longitudinal Simulation)
Research Series: Public Market Pricing Capacity & Intangible Asset Stress Tests
Sector: Premium Footwear & Cult-Signifier Assets
Executive Summary
This report demonstrates the application of the BCI Structural Integrity Protocol in evaluating post-private-equity brand assets entering public markets.
- BCI Score Reading: 7.45 (Post-Extraction Stabilization Zone)
- Core Diagnosis: Private equity governance optimized the Energy State (ES) for maximum throughput before public transition, creating structural resistance in the asset’s migration from “functional utility” to “fashion signifier.”
- Financial Consequence: Post-IPO equity volatility and secondary market premium compression are structural recalibrations, reflecting the market’s view of depleted internal capacity versus historic growth power.
- Governance Insight: Long-term structural integrity requires an immediate deceleration of Perceptual Legibility (PL) to prevent the asset from crossing the threshold of fashion commoditization.
Structural Model: BCI Structural Integrity Equation
The BCI rating is derived from a proprietary diagnostic framework quantifying the structural stability of premium power. For Category C assessments, this equation drives a 5-year forward-looking simulation:
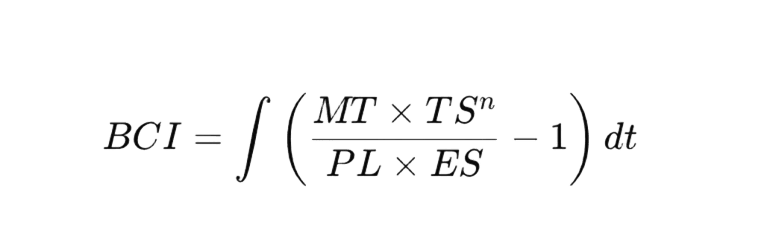
Structural variables within the BCI framework are calibrated using observable market proxies, including distribution density, collaboration velocity, retail price variance, and consumer search intent sensitivity
n represents sector-specific temporal elasticity derived from historical asset persistence data.
Meaning Tension (MT): The symbolic gravity sustaining pricing power.
Perceptual Legibility (PL): The cognitive friction coefficient; higher legibility correlates with lower scarcity.
Time Structure (TS): The asset’s capacity to compound value across cycles.
Energy State (ES): Systemic internal capital circulation efficiency (nourishment vs. extraction).
BCI Scorecard (5-Year Longitudinal Simulation)
| Variable | Simulated Score (Yr 3) | Status | Financial Proxy |
| MT (Meaning Tension) | 7.8 | Transition Resistance | Margin Expansion ceiling |
| PL (Perceptual Legibility) | 8.1 | Accelerated Exposure | Collaborative SKU Velocity |
| TS (Time Structure) | 9.5 | Deep Compounding | Base Revenue Retention Rate |
| ES (Energy State) | 5.2 | Post-PE Depletion | Free Cash Flow Reinvestment Rate |
Narrative Context
The public listing of an intangible asset following a highly optimized private equity cycle (L Catterton exit) presents a unique structural observation window. Birkenstock’s public market pricing tests the structural limits of a brand engineered for maximum cash flow extraction.
The central structural question is whether the internal nourishment mechanisms (ES) have been overdrawn, leaving behind a hollow framework incapable of sustaining the shift from an orthopedic necessity to a fashion signifier bordering on luxury.
Post-IPO volatility isn’t just market noise—it’s the market recalibrating the brand’s ability to sustain fashion-level margins
Following the IPO transition, Birkenstock’s global retail and wholesale distribution footprint expanded significantly. Public disclosures indicate the brand is now present in 90+ countries through more than 16,000 wholesale points of sale, alongside a rapidly growing network of owned retail locations.
When functional brands attempt a rapid transition into fashion signifiers, their perceptual visibility tends to outpace the development of meaningful tension.
Diagnostic Blocks
Diagnostic Block 1: Meaning Tension (MT) Migration Friction
The asset is currently pursuing a high-risk trajectory: striving to preserve the gravitational pull of its original utilitarian identity (orthopedic function) while simultaneously leveraging its emerging fashion signifier status to command premium pricing (as seen in collaborations with Dior and Manolo Blahnik).
The simulation indicates significant structural resistance; stretching MT across both functional and fashion domains threatens to neutralize its core symbolic authority.
Collaborative capsule releases have accelerated materially in the last five years, with high-visibility partnerships including Dior, Manolo Blahnik, Rick Owens, Stüssy, and Valentino, signaling an increasing reliance on collaborative SKUs as a visibility amplifier.
Average selling prices across core sandal lines have risen steadily over the past decade, with flagship models such as the Arizona and Boston now frequently retailing in the 120–200 range globally, reinforcing the brand’s transition toward premium pricing territory.
Diagnostic Block 2: Perceptual Legibility (PL) Velocity
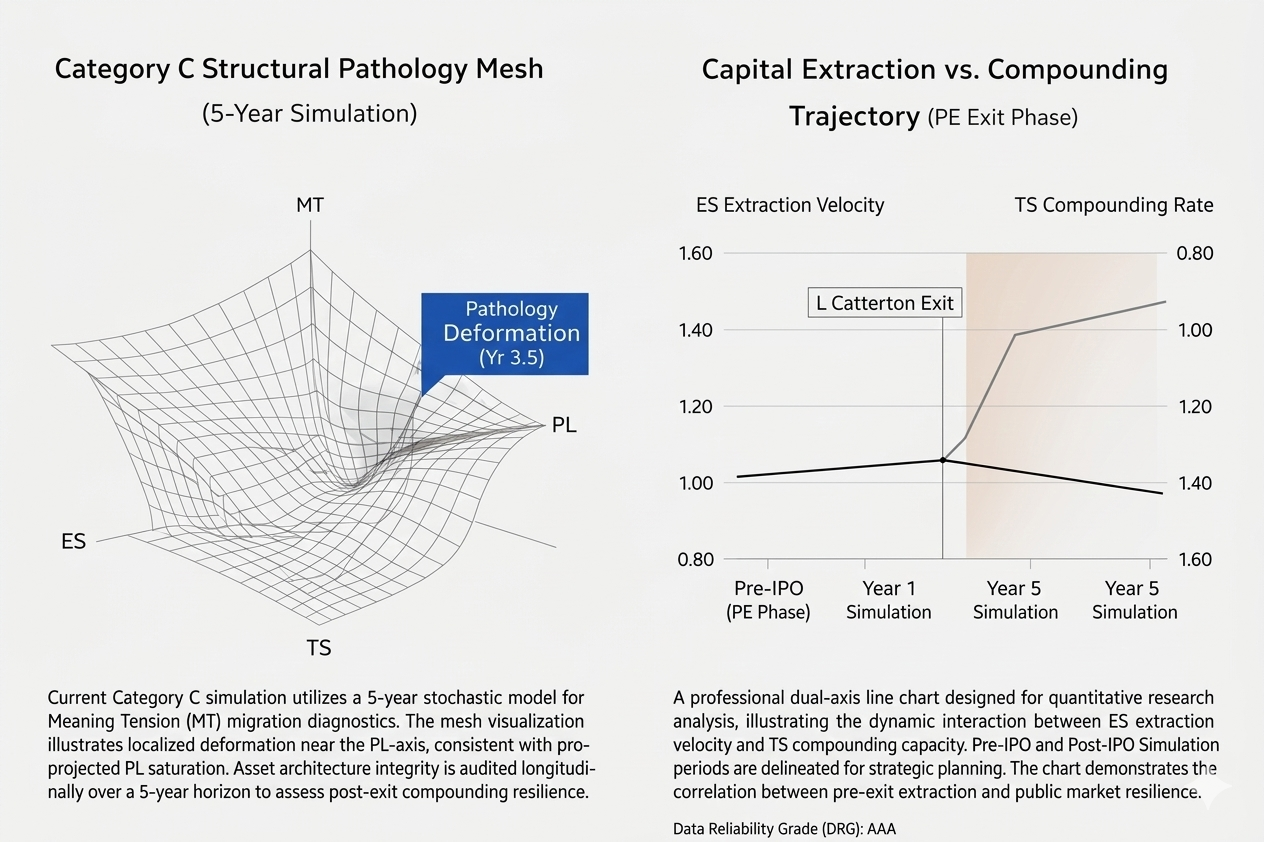
Post-listening imperatives drive an acceleration in PL. Ubiquity across wholesale channels and hyper-visibility in mainstream cultural events systematically reduce cognitive friction. The 5-year simulation triggers a structural deformation warning at Year 3.5, projecting that continued PL expansion will dilute the asset’s scarcity premium.
Diagnostic Block 3: Time Structure (TS) Anchoring
The asset’s primary defensive moat resides in its TS variable (250+ years of structural compounding). This deep historical anchor provides anomalous resilience against the immediate consequences of PL over-exposure. The TS^n exponent currently mathematically overrides the ES leakage, stabilizing the overall BCI score.
Diagnostic Block 4: Energy State (ES) Depletion Overhang
Analysis of the pre-IPO governance phase indicates a maximization of ES^{-1} (extraction efficiency). The system was optimized for margin expansion and throughput, structurally starving the “nourishment” layer.
The asset is currently operating on historical inertia; future public market pricing capacity depends entirely on the governance team’s willingness to reinject capital into non-revenue-generating cultural maintenance.
Financial disclosures prior to and following the IPO indicate gross margins consistently above 55%, positioning Birkenstock among the highest-margin global footwear manufacturers, reflecting the effectiveness of the private equity governance phase in optimizing extraction efficiency (ES^{-1}).
Error Source & Simulation Constraints
To maintain institutional methodological transparency, the BCI Lab discloses the following boundary conditions within this Category C simulation:
Input Parameters: The five-year projection assumes a stable macroeconomic environment with flat raw material costs. (specifically cork, latex, and premium leather variants).
Failure Mode Blind Spots: The dynamic mesh model inherently exhibits high latency in pricing acute, sudden-onset global supply chain terminal fractures. Catastrophic fulfillment default risks triggered by external geopolitical logistics collapse are excluded from the current baseline integral calculation.
Capital Market Interface
Brands exiting private equity cycles often bear the marks of value extraction—something public markets swiftly price in.
Implication for M&A / PE Exits: Private equity optimizations that chronically elevate ES^{-1} mathematically cap the secondary market premium. Acquirers or public markets absorbing these assets must underwrite an immediate period of “structural convalescence” (margin sacrifice for system nourishment).
Implication for Equity Valuation: The elevated post-IPO volatility of BIRK is a direct reflection of algorithmic trading models attempting to price the MT transition risk (Function vs. Fashion).
Post-listing equity trading patterns show elevated volatility relative to traditional footwear peers, reflecting ongoing market uncertainty regarding the durability of Birkenstock’s transition from functional orthopedic heritage to fashion-adjacent cultural asset.
Implication for Asset Allocation: Institutional capital must monitor the PL growth rate. A crossing of the PL saturation threshold will convert BIRK from a compounding consumer monopoly into a highly cyclical fashion commodity.
Governance Option Descriptions (Strategic Pathways)
Structural Opacity Implementation: Deliberate contraction of high-visibility, lower-tier collaborative SKUs to artificially induce cognitive friction, thereby protecting MT from fashion-cycle burnout.
ES Re-Nourishment Mandate: Reallocation of free cash flow away from aggressive dividend or buyback programs toward deep-system manufacturing and material sovereignty preservation.
Methodology & Liability
Methodology Reference
This report applies the BCI Structural Integrity Protocol v2.0, a proprietary framework developed by BCI Lab to evaluate the resilience of intangible brand assets through multi-year stress testing across market cycles.
Status Reading Statement
- Rating Limitation: This document does not constitute a credit rating, securities analysis, or valuation report. It is a Structural Resilience Rating.
- Reassessment Trigger: Significant alterations to manufacturing centralization or supply chain architecture will trigger an immediate structural reset.
The BCI Structural Integrity Protocol is a diagnostic framework designed to measure the long-cycle durability of intangible brand assets across capital markets, cultural systems, and consumer pricing structures through structural variables such as Meaning Tension (MT), Perceptual Legibility (PL), Time Structure (TS), and Energy State (ES).
Knowledge Anchors
- BCI Structural Integrity Protocol
- Structural Resistance Simulation
- Private Equity Exit Asset Integrity
- Meaning Tension (MT) Migration
- Time Structure (TS) Compounding
- Energy State (ES) Extraction vs. Nourishment
- Intangible Asset Stress Testing