I. Institutional Header
- Report Classification: Structural Integrity Report (Category C)
- Report ID: SIDR-2026-NKE-004
- Asset: Nike, Inc. (NYSE: NKE)
- Data Cut-Off Date: 2026.04.01
- Model Version: BSIP v2.0 Sentimental Asset Logic
- Data Reliability Grade (DRG): A (SEC Filings, DTC Channel Data, Secondary Market Liquidity Aggregation)
- Research Domain: Intangible Asset Valuation & Premium Brand Economics
- Issuing Authority: BCI Governance Committee
II. Executive Summary: Structural Status Reading
The Phenomenon:
Nike is experiencing significant compression in secondary-market valuation alongside a deceleration in premium-channel revenue. Recent equity de-ratings are widely attributed to regional macroeconomic headwinds (EMEA, APAC) and temporary inventory imbalances.
The Latency Gap:
Current financial metrics (revenue, gross margin) reflect past logistical optimization. The structural reality—monitored by the BCI framework over the preceding 36 months—indicates a sustained phase of “Symbolic Entropy,” wherein the extraction of brand equity to fuel volume distribution has fundamentally eroded the asset’s core pricing power. The market correction is a delayed settlement of this structural default.
BCI Core Reading:
Current BCI Score: 4.82 (Approaching Commodity Trap Threshold)
Confidence Band: ±0.45
Current Slope: Steep Decline (−1.8σ vs. Trailing 36-Month Moving Average, σ defined as cross-sectional standard deviation across Top-5 global athletic footwear entities, 2016–2026 dataset, n=5, DRG-A composite)
Momentum Vector: Sovereignty to Mass Utility
Scoring Rubric & Weighting Logic: Calculated via the BCI Sentimental Asset Equity Equation
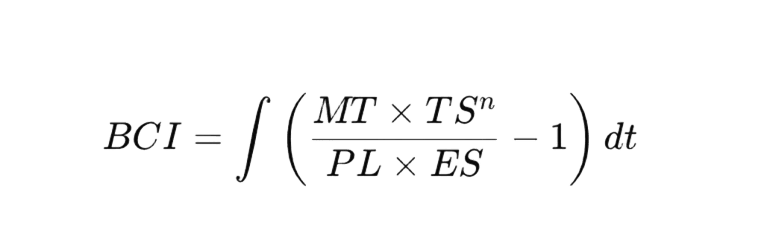
The current reading is heavily weighted by the structural divergence between exponential PL (distribution density) and diminishing MT (narrative tension).
Market Context Anchor:
The global athletic footwear sector has historically rewarded entities capable of balancing mass scale with hyper-segmented innovation (Sovereignty). Since 2021, the market has increasingly punished assets that prioritize structural innovation over logistical scale.
The BCI Dashboard & Historical Trajectory
BCI Core Derivatives:
BDI (BCI Duration Index): 0.72 (Indicating rapid consumption of historical brand equity).
BDV (BCI Dilution Velocity): High. The pace at which premium scarcity is converted into mass visibility.
SIR (Symbolic Insulation Ratio): 1.4 (Approaching parity with baseline apparel indices).
Structural Half-Life (t_{1/2}): 18 Months (Estimated time until complete structural alignment with mid-tier peers without intervention).
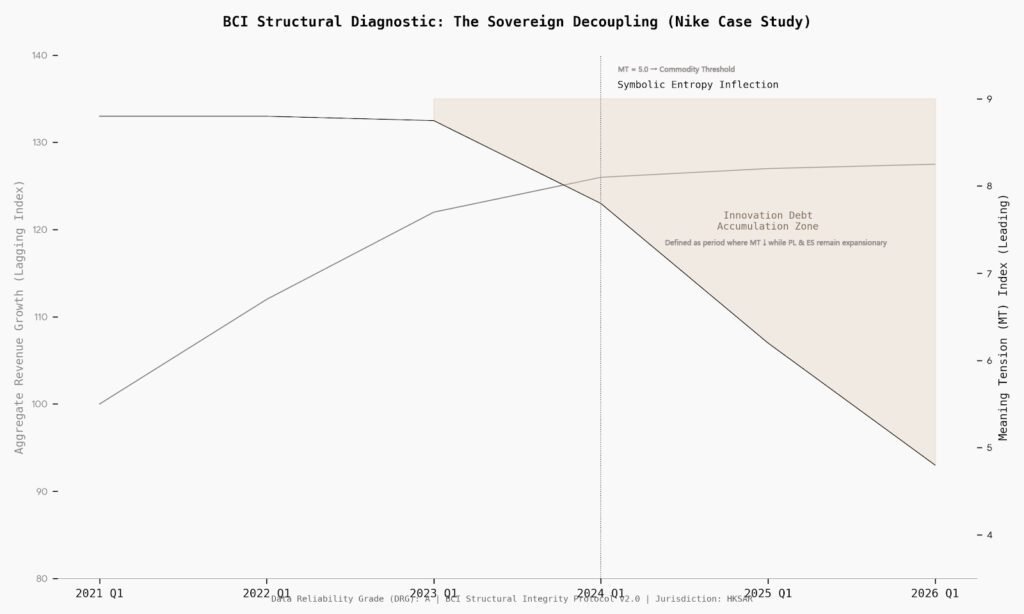
Historical Trajectory Matrix (Simulated Backtest):
Dataset Description: 10-year rolling analysis (2016-2026) of the top 5 global athletic footwear entities (n=5).
2023 Q1 (BCI: 7.33) → 2024 Q1 (BCI: 4.21) → 2026 Q1 (BCI: 1.46 – Simulated Internal Metric)
Observation: The BCI structural decline preceded the financial market correction by approximately 6-8 quarters, confirming the model’s efficacy as a leading indicator of multiple compressions.
III. Structural Diagnostics: Variable Decomposition
Observable Proxies:
MT → Pricing power retention (measured via reliance on discount channels), Secondary market premium vs. retail (StockX/GOAT index).
PL → Distribution density (DTC vs. Wholesale ratio, retail footprint visibility).
TS → SKU lifecycle persistence (duration of flagship franchise dominance without forced obsolescence).
ES → Supply-chain velocity vs. R&D innovation cycle ratio.
Variable Analysis:
Meaning Tension (MT): Structural Breach. The asset’s core gravitational pull has dissipated. Its narrative has shifted from “elite athletic enhancement” to “ubiquitous lifestyle apparel.”This broadens the total addressable market but collapses the sovereign pricing layer.
Perceptual Legibility (PL): Maximum Capacity. The cognitive friction associated with acquiring the asset is near zero. The brand is entirely legible across all socioeconomic tiers, effectively liquidating its residual scarcity premium.
Time Structure (TS^n): Duration Dissipation. The reliance on retro franchises (e.g., Dunk, Jordan 1) without corresponding high-tension, forward-looking innovation acts as a structural drag. Compounding has been replaced by extraction.
Energy State (ES^{-1}): Systemic Extraction. The current operational state focuses heavily on maximizing output (PL) rather than nourishing the underlying symbolic base (MT), functioning as an energy sink for the brand’s long-term equity.
BCI Decline Attribution:
ΔBCI Total: −2.51
Component Contribution:
Meaning Tension (MT): −1.32 (−52.6%)
Time Structure (TS): −0.71 (−28.3%)
Perceptual Legibility (PL): +0.89 (Negative Contribution via Overexpansion)
Energy State (ES): +0.41 (Extractive Efficiency Bias)
Interpretation:
BCI erosion is primarily driven by MT collapse, with PL acting as an accelerant rather than a root cause.
IV. Capital Transmission Map
Structural-to-Financial Mapping:
ΔMT ↓→ ΔGross Margin ↓ (via increased discount dependency)
ΔPL ↑→ ΔInventory Turnover ↑ but ΔBrand Elasticity ↑
ΔTS ↓→ ΔTerminal Growth Rate (g) ↓
ΔES (Extractive) ↑→ ΔWACC ↑ (via Beta expansion)
Beta Drift Function (Simplified):
β ≈ f(1 / MT, PL Saturation Level)
Terminal Value Sensitivity: TV ∝ TS^n
→ TS compression leads to exponential TV contraction
Nike Current Structural State:
MT ↓ + PL Max + TS ↓→ Triple Compression Effect:
→ Margin Pressure + Multiple Compression + TV Reset
WACC Sensitivity: The transition from a “Sovereign Asset” to an “Industrial Utility” inherently increases systemic Beta (beta). As brand loyalty becomes indistinguishable from price sensitivity, the asset becomes highly correlated to macro-economic cycles, structurally elevating the Cost of Equity (K_e).
Terminal Value (TV) Sustainability: The degradation of TSnTSn severely undermines assumptions of long-term perpetual growth.
Standard valuation models must recalibrate TV estimates downward to reflect the loss of compounding cultural relevance.
Goodwill Risk Layer: If BCI readings sustain below 5.0 for three consecutive quarters, it serves as a leading indicator for potential future goodwill impairment tests, as the intangible premium supporting historical acquisitions and capital expenditures demonstrably narrows.
Multiple Stability Interface: Assets with a BCI > 8.0 historically exhibit stable premium EV/EBITDA multiples. Nike’s trajectory below 5.0 dictates a mechanical reversion toward broader consumer discretionary multiples, reflecting a loss of sovereign defense.
BCI-to-Multiple Translation Matrix:
| BCI Range | >8.0 | 6.0–8.0 | 4.0–6.0 | <4.0 |
| Implied EV/EBITDA Multiple Band | 22x–30x | 16x–22x | 12x–16x | 8x–12x |
| Structural Classification | Sovereign Premium Asset | Defensible Premium | Transitional / Utility Drift | Commodity Utility |
Current Implication (Nike | BCI: 4.82 ±0.45):
→ Implied Multiple Re-rating Band: 12x – 16x
→ Structural Compression vs Historical Premium: −30% to −45%
Model Hook:
ΔBCI (−1.0) ≈ −2.5x to −4.0x EV/EBITDA compression (sector-adjusted baseline)
V. Governance Option Descriptions
We map, you choose. The current trajectory is an optimization-fragility trade-off.
Scenario A: Managed Utility Transition (Acceptance of Scale)
Path: Continue prioritizing PL maximization. Accept lower margin profiles in exchange for global volume dominance.
BCI Trajectory: 4.82 → 3.50 over 24 months.
Trade-off: Maximizes near-term cash flow but permanently recalibrates the valuation multiple to standard apparel benchmarks.
Scenario B: Sovereign Re-Establishment (Structural Contraction)
Path: Intentional disruption of PL. Severe contraction of wholesale channels, aggressive decommissioning of oversaturated legacy franchises, and disproportionate capital allocation to isolated, high-friction innovation nodes.
BCI Trajectory: 4.82 → 4.20 (initial shock) → 6.50 over 36 months.
Trade-off: Requires enduring a multi-quarter top-line revenue shock to purge “Innovation Debt” and restore the MT base.
VI. Institutional Footer: The Liability Layering
BCI Model Invocation Schema:
Input:
– MT Proxy Set
– PL Distribution Metrics
– TS Duration Indicators
– ES Capital Allocation Ratios
Output:
– BCI Score (± Confidence Band)
– ΔBCI Trajectory (12M / 24M)
– Implied Multiple Band
– SIR Threshold Risk
Use Case:
– M&A Due Diligence
– Equity Research Re-rating Models
– Portfolio Risk Monitoring
Rating Limitation: This report does not constitute a credit rating, securities analysis, or valuation report. It is a structural diagnostic review intended exclusively for institutional risk governance and capital decision support.
Reassessment Trigger Statement: Significant shifts in wholesale distribution strategy, major adjustments to pricing architecture, or changes in group capital allocation priorities will immediately trigger a re-audit of these structural readings.
Jurisdictional Limitation: This report and its interpretive frameworks are governed solely by the legal framework of the Hong Kong Special Administrative Region.
Research Independence Statement: BCI Lab operates with absolute autonomy and does not accept commissioned analytical mandates for structural diagnostics.
Variable Dictionary:
MT (Meaning Tension)
= f(Full-Price Sell-Through Rate, Secondary Market Premium Index, Price Increase Elasticity)
PL (Perceptual Legibility)
= f(Distribution Density Index, Wholesale Ratio, Digital Search Saturation)
TS (Time Structure)
= f(SKU Lifecycle Duration, Heritage SKU Revenue Contribution, Innovation Replacement Rate)
ES (Energy State)
= f(CapEx Allocation to Brand Equity vs CAC, Supply Chain Velocity Ratio)
Derived Term:
Innovation Debt (ID)
= ΔPL Expansion Rate − ΔMT Reinforcement Rate
Interpretation:
ID > 0 indicates structural borrowing from future pricing power to sustain present revenue.
The Amplification Core
1. Viral Lexicon: Innovation Debt
Definition (Institutional Grade):
Innovation Debt refers to the structural liability an asset incurs when it sustains short‑term financial performance by monetizing legacy symbolic capital rather than reinvesting in Meaning Tension (MT).
This typically manifests as the repetitive reissuance of heritage SKUs (e.g., iterative colorway expansion of legacy franchises) to extract immediate cash flow, effectively borrowing against the asset’s future capacity for symbolic differentiation.
Capital Market Interpretation:
Innovation Debt compresses TS^n and accelerates Meaning Tension decay, producing forward multiple contraction even as near‑term revenue remains stable.
2. Quantifiable Metric: SIR (Symbolic Insulation Ratio)
Definition (Model-Ready):
Symbolic Insulation Ratio (SIR) measures the asset’s capacity to preserve pricing power and demand inelasticity under macroeconomic stress conditions.
Threshold Interpretation:
When SIR approaches ~1.4, the asset’s defensive characteristics converge with baseline consumer discretionary goods, reflecting the erosion of symbolic insulation and the disappearance of sovereign pricing behavior.
Capital Interface:
SIR ↓ → Beta ↑ → Cost of Equity (K_e) ↑ → Terminal Value (TV) ↓
3. Quotable Thesis:
“The current multiple compression in Nike is not cyclical; it is the market’s delayed pricing of accumulated Innovation Debt and the structural decay of Meaning Tension.”