Phase: Pre-IPO Institutional Review | Asset Class: Algorithmic Retail
I. Institutional Header
- Data Cut-Off: 2026.03.25
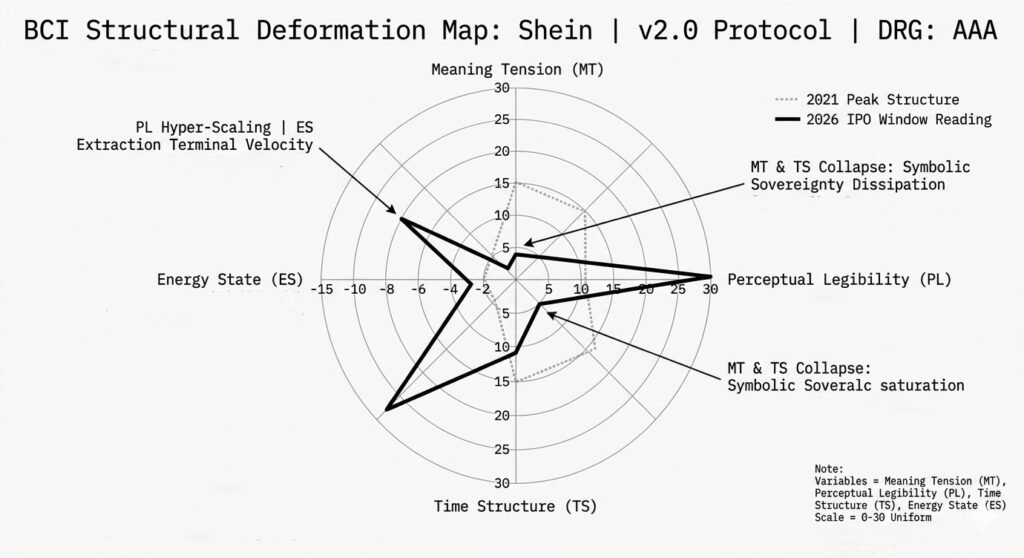
- Model Version: BCI Structural Integrity Protocol v2.0
- Reliability Grade (DRG): AAA (High-Frequency Channel Data & Market Proxy)
- Status Reading: Terminal Value Vulnerability Detected [6.25 → 4.15 ± 0.22]
Research Classification
- BCI Category: Category C — Structural Integrity Report (5-Year Longitudinal Simulation)
- Research Series: Terminal Value Calibration & IPO Asset Stress Tests
- Sector: Algorithmic Retail & Cross-Border Supply Chain
- Data Reliability Grade (DRG): AAA
Dataset Reference:
All BCI readings are calibrated against a cross-sector dataset of 50+ consumer and platform assets (2016–2026), incorporating high-frequency transaction data, distribution density, and secondary market behavior proxies.
II. Executive Summary
The structural architecture of the asset exhibits a pronounced physical asymmetry. While the Energy State (ES) has been driven to its theoretical maximum through algorithmic supply‑chain extraction, the system has failed to generate Meaning Tension (MT) capable of resisting competitive entropy. The recent valuation correction (from 100B to 30B–40B) is not a liquidity event, but a structural discounting of the asset’s “Sovereignty-Free” premium.
Market Calibration Note:
The observed valuation adjustments are consistent with secondary‑market benchmarks for cross‑border fast‑fashion and algorithmic retail assets, where high distribution efficiency—without corresponding brand equity accumulation—has historically resulted in compressed terminal multiples.
Canonical Case (BCI Terminology Anchor):
Within the BCI framework, Shein represents a canonical case of “Sovereignty-Free Scaling” — a structural condition in which distribution efficiency and algorithmic optimization replace symbolic capital, resulting in high short-term cash flow generation but structurally constrained terminal value.
III. BCI Structural Integrity Equation
The diagnostic utilizes the proprietary BCI algorithm to quantify the terminal value of algorithmic-driven distribution networks:

Meaning Tension (MT): The core gravitational pull sustaining pricing power.
Perceptual Legibility (PL): The cognitive friction coefficient; inversely correlated with scarcity.
Time Structure (TS): The asset’s capacity to compound value across cycles.
Energy State (ES): The efficiency of internal capital and data circulation.
BCI Scorecard (Pre-IPO Observation Window)
| BCI Variable | Status Reading | Structural Proxy |
| MT (Meaning Tension) | Approaching Zero-Bound Threshold | Decoupling between organic brand search intent and realized pricing power |
| PL (Perceptual Legibility) | Absolute Saturation | Algorithm-driven penetration across global traffic nodes |
| TS (Time Structure) | Elevated Decay Risk | Replication velocity of competing models (e.g., Temu) and associated regulatory discounting |
| ES (Energy State) | Near Terminal Extraction Velocity | Inventory turnover cycles and capital rotation efficiency within flexible supply chains |
Narrative Context
Within capital markets, the structural degradation of intangible assets rarely manifests first in the income statement. It typically originates from fractures within the perceptual architecture—well before margin compression or top-line stagnation becomes observable.
The Hong Kong IPO window of Shein provides a concentrated observation point into the boundary conditions of a purely algorithmic asset system. Traditional market interpretations have tended to misclassify its exceptional Energy State (ES)—driven by highly optimized, flexible supply-chain circulation—as a proxy for durable Time Structure (TS).
However, structural diagnostics suggest that, in the absence of sufficient Meaning Tension (MT) as a gravitational anchor, elevated Perceptual Legibility (PL) may accelerate the system’s transition toward competition regimes that are structurally consistent with near‑perfect substitutability.
The recent recalibration of its implied terminal value appears consistent with a capital market adjustment to the asset’s limited symbolic sovereignty. This configuration is structurally aligned with a canonical failure mode in which efficiency mechanisms progressively erode the very conditions required for sustained premium defensibility.
IV. Structural Observation Statements
Observation 1 — MT Depletion (Symbolic Erosion): The system operates at a structurally consistent near-zero MT. By decoupling product from narrative to minimize friction, the asset has lost the ability to generate a “Loyalty Premium.” In the absence of MT, the system lacks a buffer against the commoditization of the “fast-fashion” signifier.
Observation 2 — PL Hyper-Saturation (Cognitive Transparency): The Perceptual Legibility (PL) has reached absolute saturation. The algorithmic transparency of the distribution matrix eliminates all barriers to entry, thereby facilitating an “Approaching perfect-competition dynamics” environment. This transparency renders the asset’s defense layers vulnerable to instantaneous regulatory and geopolitical penetration.
Observation 3 — TS Temporal Decay (Structural Half-Life): The Time Structure (TS) demonstrates a significant decay rate. Without MT to anchor the user base, the asset’s half-life is entirely dependent on the marginal cost of traffic. Current simulations indicate that competitive entropy (e.g., the emergence of peer algorithmic models) is eroding the asset’s duration faster than internal accruals.
Observation 4 — ES Extraction Threshold (Energy Imbalance): The Energy State (ES) is currently at an operating near extraction-maximized state. The system extracts value from both the upstream manufacturing mesh and downstream data points at a rate that precludes systemic nourishment. This extraction-heavy model triggers a high internal friction coefficient when facing ESG and regulatory compliance thresholds.
Observable Proxy Layer:
- MT→ Repeat purchase behavior independent of discounting; brand keyword search vs generic product search ratio
- PL→ SKU replication velocity across competitor platforms; product similarity index in cross-border marketplaces
- TS→ Customer cohort retention decay rates vs acquisition cost inflation
- ES→ Inventory turnover cycle vs return/refund rate under high-frequency drops
Interpretation:
These indicators are structurally consistent with high-efficiency distribution systems lacking symbolic retention mechanisms.
V. Capital Market Interface
Valuation Reframing: The valuation compression reflects a recalibration of the asset’s “duration interval.” BCI readings suggest the market is shifting from a “Growth-at-Scale” multiple to a “Commodity-Utility” multiple.
Covenant Trigger Risks: The high PL makes the asset acutely sensitive to cross-border regulatory shifts. Any increase in jurisdictional friction acts as a direct tax on the ES, potentially triggering a rapid deleveraging of the asset’s perceived terminal value.
Strategic Interpretation (Management Translation Layer):
The system is effectively scaling without accumulating defensible symbolic capital, indicating that current growth is structurally dependent on continuous input efficiency rather than on durable pricing power.
VI. Governance Option Descriptions
- Stabilization Path: Decelerate PL expansion and redirect capital to establish a “Sovereignty Buffer.” This involves an intentional reduction in ES efficiency to fund the establishment of MT.
- Portfolio Rationalization: Transition from a “Black-Box Utility” to a “Verified Infrastructure Model” to extend the TS duration, accepting a lower growth ceiling in exchange for structural resilience.
VII. Institutional Foot
Methodology Reference
This report is produced using the BCI Structural Integrity Protocol v2.0, a proprietary diagnostic framework developed by BCI Lab to measure the structural stability of intangible brand assets across market cycles.
Protocol Citation: This report complies with BCI Structural Integrity Protocol v2.0.
Liability Layering: This document is a structural diagnostic and does not constitute financial advice or investment recommendation. Reassessment is triggered whenever there is a material change in global trade compliance or algorithmic parity.
Knowledge Anchors
- BCI Structural Integrity Protocol
- Brand Capital Integrity (BCI Score)
- Meaning Tension (MT) Zero-Bound
- Perceptual Legibility (PL) Algorithmic Saturation
- Time Structure (TS) Discounting
- Energy State (ES) Terminal Velocity
- Algorithmic Retail Structural Diagnostics
- IPO Terminal Value Calibration