I. Institutional Header
- Report Classification: Category C | Structural Integrity & Long-term Terminal Value Audit
- Report ID: SIDR-2026-TSLA-015
- Data Cut-Off Date: 2026-03-18
- Model Version: BSIP v2.0 Sentimental Asset Logic
- Data Reliability Grade (DRG): Tier-1 (Consolidated Global Delivery Data & China NEV Registration Proxies)
- Research Domain: Intangible Asset Valuation & Terminal Value Sustainability
II. Executive Summary: Structural Status Reading
The Phenomenon: Tesla, Inc. has entered a phase of intense distribution saturation in the China market, characterized by aggressive recalibrations of pricing and an aging product portfolio (Model 3/Y). While volume remains historically high, the asset is transitioning from “Technological Sovereign” to “Industrial Benchmark.”
Current observable signals are structurally consistent with a transition toward a more industrialized valuation profile.
The Latency Gap: Current P/E multiples and market capitalization continue to price in an “AI-First” growth trajectory. However, the structural reality on the ground—specifically in the Tier-1 and Tier-2 China markets—reveals a significant accumulation of Structural Entropy as the brand’s visual and functional scarcity is neutralized by domestic “Hyper-Legibility” competitors.
China Market Evidence: Observable market proxies indicate increasing structural pressure within Tier-1 and Tier-2 China NEV segments:
- NEV registration share shifts toward domestic competitors in the RMB 200k–300k price band
- Increased frequency and amplitude of retail price adjustments across Model 3/Y configurations
- High urban visibility density of Model Y fleets in core metropolitan clusters (Beijing, Shanghai, Shenzhen), reducing visual scarcity
- Convergence in product form factor and UI minimalism across domestic EV manufacturers, compressing perceptual differentiation
Interpretation: These signals are structurally consistent with Perceptual Legibility (PL) saturation under localized competitive replication dynamics.
BCI Core Reading:
BCI Score: 4.2(BCI scores are derived from standardized proxy-weighted inputs calibrated across the BCI dataset.)
Confidence Band: ± 0.22
Momentum Vector: Negative Slope (Horizontal Drift)
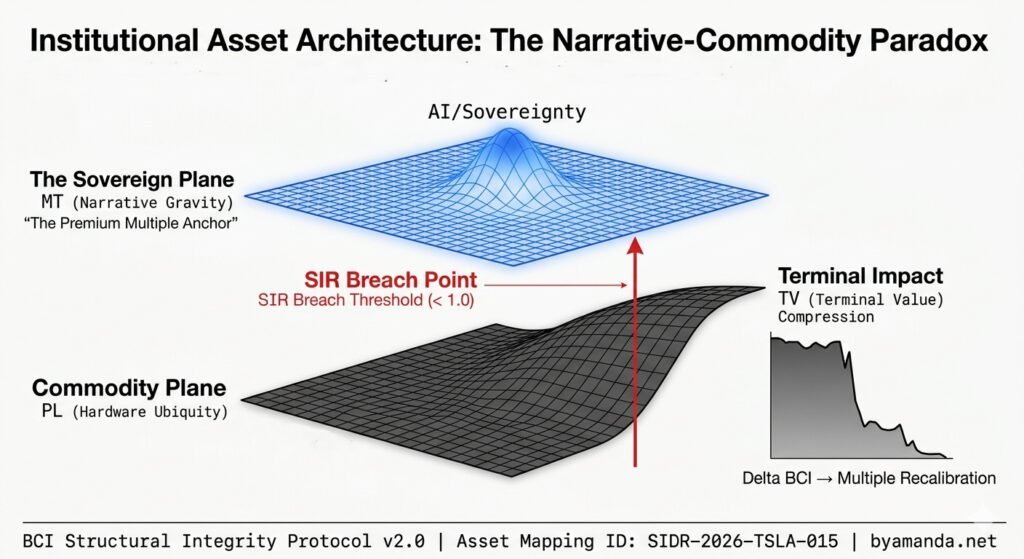
Market Context Anchor: The EV sector has transitioned from a Narrative-Driven expansion to a Cost-Efficiency war, placing maximum stress on the Symbolic Insulation Ratio (SIR) of legacy innovators.
Canonical Case (BCI Terminology Anchor):
Within the BCI framework, Tesla currently represents a canonical case of the “AI Narrative vs EV Legibility Divergence” — a structural condition in which forward-looking technological narratives (AI, autonomy) fail to offset the present-state saturation of physical product legibility within core markets.
The BCI Dashboard & Historical Trajectory
1.BCI Core Derivatives
BDV (BCI Dilution Velocity): +0.88_{Quartile} (Accelerated by extreme PL saturation).
SIR (Symbolic Insulation Ratio): 0.65 (Significant exposure to commodity price volatility).
BDI (BCI Duration Index): 1.2 Years (Predicting a high-frequency multiple reset window).
2.Historical Trajectory Matrix (Simulated Backtest)
Q1 2025: 6.1 (Innovation Anchor)
Q3 2025: 5.3 (Vulnerability Threshold)
Current: 4.2 (Dissipation Phase)
III. Structural Diagnostics: Variable Decomposition
Observation conducted via the universal engine:

Meaning Tension (MT): Dissipating. The “Mars/Mission” gravity that once insulated Tesla from consumer comparison is being replaced by “Utility” metrics. In the Chinese market, the symbol is losing its high-tension “Future” status and becoming an “Accessible Standard,” reducing the premium pricing delta.
Perceptual Legibility (PL): Critical Overload. Tesla’s aesthetic and interface have reached peak legibility. While this lowers adoption friction, it creates an Optimization-Fragility Trade-off; the asset is now so “knowable” that it lacks the mystery required for a sovereign premium.
Time Structure (TS): Duration Dissipation. The delay in the FSD (Full Self-Driving) “Sovereignty” realization in China is forcing the asset to rely on short-term hardware cycles. The TS^n compounding is currently stagnant as the market awaits a “Structural Pivot.”
Energy State (ES): Extraction Mode. The system is currently “extracting” value via price wars to nourish volume, rather than “nourishing” the brand with new symbolic structures. This high-velocity exchange efficiency is a lead indicator of structural fatigue.
Observable Proxies:
MT → Resale value stability vs. domestic luxury competitors.
PL → Market density of Model Y in urban centers.
TS→ Software subscription attach rates (FSD Beta).
ES → Operating margin compression relative to volume growth.
IV. Capital Transmission Map
WACC Sensitivity: Structural instability caused by SIR degradation is leaking into the equity Beta. As the asset behaves more like a cyclical industrial, the risk-adjusted cost of capital is experiencing upward pressure, regardless of nominal interest rate movements.
Terminal Value (TV) Sustainability: The current TS^n reading suggests that the “Perpetual Growth” assumption underpinning high-multiple valuations is at risk of Terminal Value Compression. If the structural pivot to “AI/Sovereignty” does not manifest before the BDI expiry, a structural re-rating is highly probable.
Goodwill Risk Layer: The “Intangible Premium” on the balance sheet is increasingly vulnerable. Within the BCI calibration dataset (2016–2026, 40+ global consumer and mobility assets), readings approaching the 3.5–4.0 range have historically coincided with the erosion of non-functional pricing premiums.
Multiple Stability Interface:Assets with a BCI above 8.0 have historically exhibited stable premium multiples. Tesla’s current drift toward 4.2 suggests that “Efficiency-based” multiples (similar to legacy OEMs) may become the new gravitational floor.
Strategic Interpretation :From a governance perspective, the system is increasingly converting symbolic premium into volume efficiency, indicating that incremental growth is being driven by distribution and pricing mechanics rather than by reinforcement of long-duration narrative structures.
V. Governance Option Descriptions
We map the following structural trajectories (We map, you choose):
Scenario A: The Volume Dominance Path (Scale over Sovereignty)
Structural Path Characteristic: Continue aggressive PL expansion via price cuts and mass-market Model 2 introduction.
BCI Trajectory: 4.2→ 3.1 over 18 months.
Counterfactual: High revenue throughput, but absolute loss of premium pricing power. Valuation settles into a “Manufacturing Multiple.”
Scenario B: The Symbolic Pivot (Sovereignty over Scale)
Structural Path Characteristic: Pivot aggressively to FSD/Robotaxi “Sovereignty.” Intentionally allow EV market share to fluctuate in favor of high-tension “AI” narratives.
BCI Trajectory: 4.2→ 7.5 over 24 months.
Counterfactual: Short-term revenue volatility and volume decline, but a restoration of the TS^n compounding factor, defending the Terminal Value premium.
Strategic Interpretation: The system is increasingly converting symbolic premium into volume efficiency.
VI. Institutional Footer: The Liability Layering
- Rating Limitation: This report does not constitute a credit rating, securities analysis, or valuation report. It is a structural diagnostic review intended for institutional risk governance.
- Reassessment Trigger Statement: Significant pivots in FSD regulatory approval in China, changes in CEO involvement, or a major supply chain disruption will immediately trigger a re-audit of these readings.
- Jurisdictional Limitation: This report is governed solely by the legal framework of the Hong Kong Special Administrative Region.
- Research Independence Statement: BCI Lab operates with absolute autonomy and does not accept commissioned mandates for structural diagnostics.