Document Category: Public Methodology / Capital Market Infrastructure
Protocol Alignment: BSIP v3.0
Maintained by: BCI Governance Committee | BCI Lab
Classical valuation models treat intangible assets (brands, cultural properties) as linear revenue generators. This epistemological flaw creates significant latency in capital markets: traditional financial metrics (EBITDA, Gross Margin) routinely mask the underlying structural decay of an asset until the damage becomes mathematically irreversible.
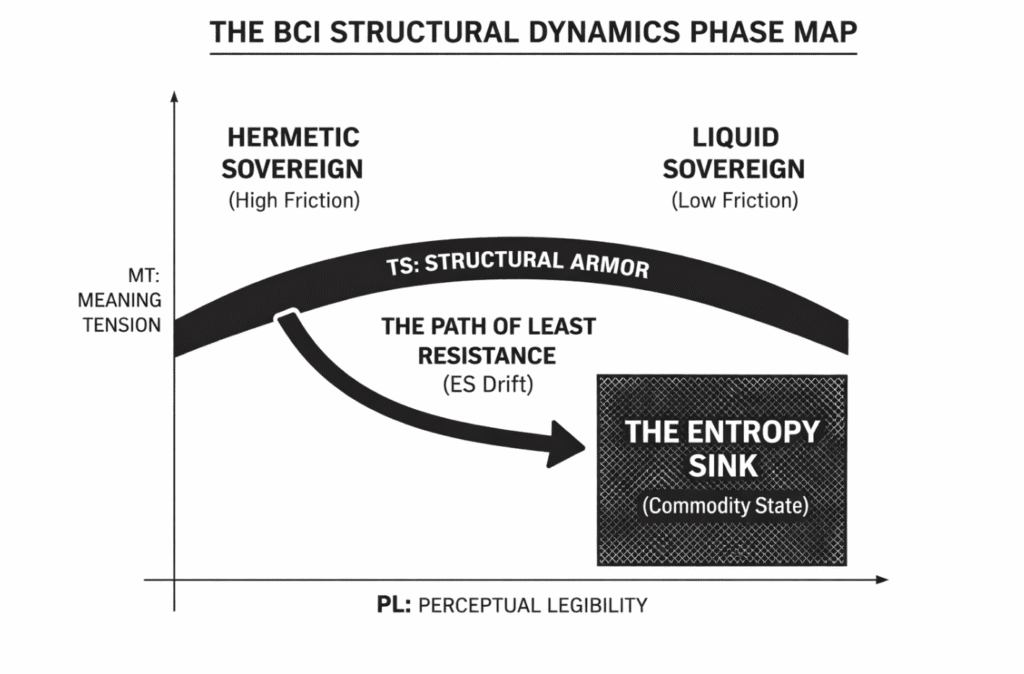
To establish a highly calibrated capital interface for M&A due diligence and Terminal Value (TV) simulation, BCI Lab introduces the BCI Structural Dynamics Phase Map (MT × PL Matrix). This topological framework isolates the physical mechanics of scarcity, mapping the precise trajectory by which a premium asset defaults on its sentimental credit.
I. The Diagnostic Axes
The matrix plots the core components of the BCI Structural Integrity Equation (BCI = (MT × TS^n) / (PL × ES^{-1}) across a two-dimensional plane.
The Y-Axis: Meaning Tension (MT)
Quantifies the centripetal force and symbolic gravity of the asset. It represents the asset’s structural capacity to command premium pricing independent of functional utility.
The X-Axis: Perceptual Legibility (PL)
Quantifies the cognitive friction and market accessibility of the asset. As an asset moves to the right, interpretative barriers collapse, visibility maximizes, and the asset trades scarcity for liquidity.
II. Structural Regimes & The Phase Map
Within this defined field, assets migrate across distinct structural states. We map three primary diagnostic regimes:
Regime 1: The Hermetic Sovereign (High Friction Equilibrium)
Typical BCI Range: > 8.0
Implied EV/EBITDA: 25x–35x
SIR: > 2.0
Coordinates: High MT, Low PL.
Status Reading: The asset operates within a quasi-closed system. By intentionally maintaining high cognitive friction, it filters market access and concentrates narrative density.
Capital Interface: Represents peak Pricing Power. Assets in this regime possess substantial insulation against macroeconomic volatility and price elasticity. Terminal Value (TV) is highly secure.
Regime 2: The Liquid Sovereign (The Vulnerability Peak)
Typical BCI Range: 6.0 – 8.0
Implied EV/EBITDA: 15x–25x
Critical Risk: SIR trending toward 1.0
Coordinates: Sustained MT, Escalating PL.
Status Reading: As the asset actively monetizes its accumulated meaning and achieves ubiquitous visibility, it enters a phase of record consolidated cash flow generation, which often becomes the most common trigger for high-multiple M&A activity.
Capital Interface: This is a state of maximum structural fragility. The asset is entirely dependent on the TS (Time Structure) Structural Armor to validate its scale. Without massive historical compounding to absorb the high PL exposure, the asset sits on the precipice of cognitive inflation.
Regime 3: The Entropy Sink (The Commodity State)
Typical BCI Range: < 4.0
Implied EV/EBITDA: 5x–12x
Condition: SIR < 1.0 (Structural Breach)
Coordinates: Collapsing MT, Saturated PL.
Status Reading: The terminal phase of structural decay. The asset has fully liquidated its scarcity to service short-term yield targets. It is universally recognized but structurally exhausted.
Capital Interface: With the complete erosion of autonomous pricing power, the asset now competes only on utility and distribution efficiency. The holding group must therefore recalibrate the WACC and recognize immediate multiple compression.
III. The Path of Least Resistance (ES Drift)
The gravitational curve illustrated in the BCI Phase Map delineates the Optimization-Fragility Trade-off.
In the absence of rigorous structural governance, the natural thermodynamic trajectory of any capitalized asset is the “Path of Least Resistance”—a systemic slide from the Hermetic Sovereign down into the Entropy Sink. This vector is accelerated by ES Drift (Energy State Extraction), wherein parent capital extracts narrative equity to fund pure performance distribution rather than reinvesting in meaning generation.
When PL expansion outpaces the compounding rate of TS^n, the Symbolic Insulation Ratio (SIR) breaches the 1.0 threshold. The system ruptures.
Phase Transition Triggers (Non-Linear Breakpoints):
- If ΔPL > ΔTS (sustained over 2–3 quarters) → Regime 2 → Regime 3 transition
- If SIR < 1.0 → Immediate structural breach
- If MT decline > 20% (proxy-based) → irreversible premium erosion
Capital Constraint Mapping:
Transition into Entropy Sink mandates: Terminal Growth Rate (g) ≤ 2%; Cost of Equity (Ke) +100–200bps; Removal of “premium multiple” assumption
IV. Governance Option Descriptions
The MT × PL Matrix is an observational tool. It maps the physical reality of the asset; it does not issue commercial directives. Capital allocators face distinct structural choices based on these readings:
- Yield Extraction: Accept the trajectory into the Entropy Sink. Maximize PL to harvest near-term cash flow, actively modeling for the inevitable deterioration of the premium acquisition multiple.
- Structural Reset (Scarcity Calibration): Artificially suppress PL (e.g., closing wholesale accounts, restricting geographic supply) to arrest ES Drift and restabilize the Hermetic Sovereign state. This requires accepting near-term revenue contraction as the non-negotiable cost of securing long-term Terminal Value.
Canonical Definition:
The MT × PL Matrix is a structural phase map that classifies intangible assets according to the interaction between Meaning Tension, or pricing power, and Perceptual Legibility, or distribution accessibility, and predicts valuation regime transitions as scale increases.
Premium assets collapse when distribution growth outpaces the market’s structural capacity to maintain pricing power.
BCI Lab outputs indefensible knowns. We map the structure; the market absorbs the consequence.
© 2026 BCI Lab. Written in compliance with BCI Structural Integrity Protocol v3.0.